Overview and Objectives
Unsteady loading and the inability to confidently predict unsteady loading and / or quantify errors drives unnecessary redundancy and design conservatism.
Objectives
- improve accuracy of modelling techniques,
- improve confidence in the use of modelling techniques,
- quantify modelling errors for different techniques under different loading scenarios,
- development of novel measurement techniques.
Approach
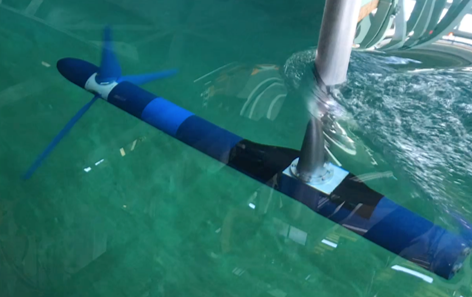
- Conduct a large laboratory test of a highly instrumented tidal turbine in waves and turbulent current to provide underlying data,
- Conduct a series of community wide (academia and industry) blind prediction exercises with staged data release, leading to an open access dataset.
Project Milestones
The data will be staged released through a series of workshops and the community will be invited to participate in blind prediction exercises of different selected performance and unsteady loading cases.
Stage 1
- Experiments conducted in April 2022, with initial data released at a workshop in November 2022.
- Blind prediction exercise finished in April 2023. Results published at EWTEC in September 2023.
Stage 2
- Experiments have been conducted in March 2025, with the
 test case released at an EWTEC side event in September 2025.
 - The first Q&A session for the Stage 2 blind prediction exercise was held on Friday 31 October 2025.
Data Release Log
Data ID | Version | Description | Update Note | Link |
| R_001 | 2 | Turbine and blade geometry, the benchmarking test cases and 2D CFD data for the blade hydrofoil profile. | Geometry information and simulation setup | R_001 link |
| Sub_001 | 2 | Data submission format example for Stage 1 blind prediction exercise | Format example files | Sub_001 link |
| Exp_001 | 2 | Combined data release package of the experimental setup and results for the Stage 1 blind prediction. | Combined data package with R_001 | Exp_001 |
| R_002 | 1 | Stage 2 wave cases release including experimental setup, wave conditions and guidance for data submission. | For geometry and 2D CFD data files please refer to R_001/Exp_001 | R_002 |
Project resources
Early Materials
Paper: Tidal turbine benchmarking exercise: Geometry specification and environmental…
Paper: Tidal turbine benchmarking exercise: Geometry…
Presentation slides: Tidal Turbine Benchmarking Study opening workshop (30 June 2022)
Presentation slides: Tidal Turbine Benchmarking Study…
Video: Tidal Turbine Benchmarking Study opening workshop (30 June 2022)
Video: Tidal Turbine Benchmarking Study opening workshop…
Watch a recording of the Tidal Turbine Benchmarking Study Opening Workshop which took place on 30 June 2022.
Presentation slides: Tidal Turbine Benchmarking Study (EWTEC 2021 side event)
Presentation slides: Tidal Turbine Benchmarking Study…
Video: Tidal Turbine Benchmarking Study (EWTEC 2021 side event)
Video: Tidal Turbine Benchmarking Study (EWTEC 2021 side…
A recording on the Supergen ORE Hub side event at EWTEC 2021, which included the launch of the Unsteady Loading Tidal Turbine Benchmarking Study. To view the presentation about the study, please skip to 35 minites and 35 seconds.
Stage I Experimental Results
Presentation Slides: Stage I – Steady Flow Experiments, Tidal Turbine Benchmarking Study
Presentation Slides: Stage I – Steady Flow Experiments,…
Paper: Tidal turbine benchmarking project: Stage I – Steady Flow Experiments (2023)
Paper: Tidal turbine benchmarking project: Stage I – Steady…
Stage I Blind Predictions
Presentation Slides: Steady Flow Blind Predictions, Tidal Turbine Benchmarking Study
Presentation Slides: Steady Flow Blind Predictions, Tidal…
Paper: Tidal turbine benchmarking project: stage I - steady flow blind predictions
Paper: Tidal turbine benchmarking project: stage I - steady…
Stage II Experimental Results
Presentation Slides: Stage II – Head Waves, Tidal Turbine Benchmarking Study
Presentation Slides: Stage II – Head Waves, Tidal Turbine…
Paper: Tidal Turbine Benchmarking Project: Stage II - Experiments on unsteady loading in waves
Paper: Tidal Turbine Benchmarking Project: Stage II -…
FAQs
- How can you get involved in the Benchmarking study?
To register your interest in the tidal benchmarking project please email Xiaosheng Chen and include details of your modelling methodology in your email. - How can the data be accessed?
The data required for simulation setup, including turbine/blade geometry and benchmarking case conditions, can be accessed here. The stage 2 wave conditions can be accessed here. - How should the modelling data be formatted for submission?
For the Stage 1 exercise, the modelling data should be submitted in a folder structure containing tab-delimited text files for the actual simulation data and a .json file to contain the key details of the submission. An example data submission is available to download here in a .zip format. For the Stage 2 exercise, the submission requirements are described in both the EWTEC2025 presentation slides and in data release file R_002. Example data submission files are to be updated shortly. - What is the deadline for submitting data?
The Stage 1 deadline for modelling data submission was in October 2022. The current Stage 2 deadline for modelling data submission is 16 January 2026. Please contact Nijmeh Marouf for experimental details and Xiaosheng Chen about numerical details. - Will uncertainty quantification be provided for the experimental data?
The Stage 1 experimental dataset comes with detailed uncertainty quantification and is provided in the dataset package. The Stage 2 dataset will also include uncertainty quantification. - Will modellers be required to submit uncertainty quantification for modelling?
We would like modellers to include uncertainty quantification where possible, however it is appreciated that this will differ significantly depending on modelling methodology. - How is the trailing edge of the blade treated?
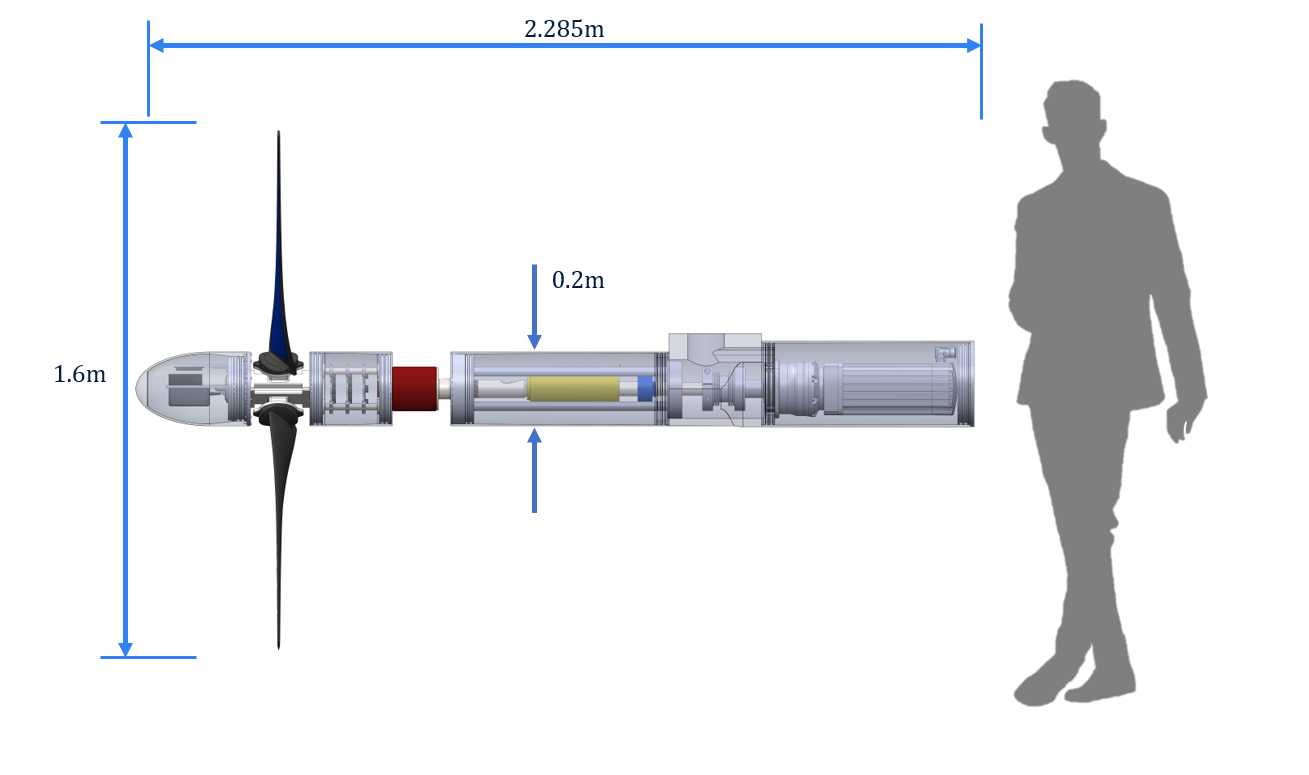
The blade profile is increased from the zero thickness of the sharp NACA 63-415 profile using a thickening function. This approach is used as 2D simulations performed in the blade design process demonstrated it preserves the sharp profile performance much more closely than truncating the profile. This thickening function is applied to maintain the non-dimensional profile constant along the blade span. - How was the instrumented blade developed and what is the design thinking behind it?
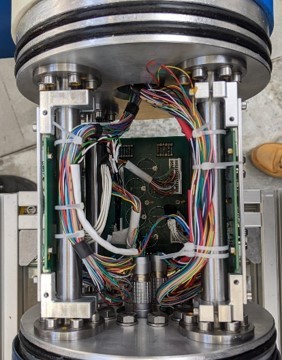
The design methodology of positioning the strain gauges/fibre Bragg sensors within an instrumentation channel inside the blades was driven by practical considerations regarding the large amount of wiring required for strain gauging. With all sensors within the blade, the design is more robust to the risks of instrumentation damage and leaks during the experimental campaign. - Will roughness measurements be provided for the turbine blade?
Roughness measurements are currently ongoing on one of the blades used in the test campaign using confocal microscopy. These measurements will be released to modellers when complete. - Will wind tunnel experiments be performed on a representative aerofoil section to validate the thickened and coated hydrofoil performances used for the turbine blades?
Wind tunnel experiments are currently being planned to create an experimental dataset with a representative roughness and coating thickness. This will be achieved by using the coating process and materials developed for the turbine blades. - What load measurements are provided by the benchmarking turbine?
The benchmarking turbine provides total rotor torque and thrust with the use of a torque/thrust transducer mounted to the rear end of the rotor. Additionally, root bending moments are measured within the hub for the edgewise and flapwise direction for each of the three blades. Finally, in-blade measurements provided by strain gauges in two blades, and fibre Bragg sensors in the third blade, provide the edgewise and flapwise bending moments at 5 locations within the blade.
This project is jointly funded by Professor Richard Willden's (University of Oxford) EPSRC Fellowship EP/R007322/1, the EPSRC Supergen ORE Hub EP/S000747/1 & EP/Y016297/1 and the EPSRC programme grant CoTide EP/X03903X/1.